- Published on
Server Sent Events with Camel Quarkus
- Authors
- Name
- James Netherton
A topic that occasionally comes up from Apache Camel users, is how to work with Server-Sent Events (SSE) in a Camel application.
At present, there is no dedicated SSE Camel component, so upvote CAMEL-16431 if you're interested. However, frameworks like Quarkus and Spring Boot provide SSE functionality that can be used in conjunction with Camel.
Here's an example of a Camel Quarkus application that will publish the exchange message body flowing through a Camel route as an SSE.
System Monitoring Dashboard Application
The theme for the example is a simple system monitoring dashboard. A web frontend will collect and chart metrics emitted as SSEs from a RESTEasy endpoint.
We'll be using the following Quarkus extensions for the backend:
- Quarkus RESTEasy Reactive Jackson for SSE and JSON serialization support
- SmallRye Reactive Messaging Camel for Apache Camel to Reactive Messaging support
- Camel Quarkus Timer to periodically trigger metrics collection
- Camel Quarkus Micrometer for runtime metrics
For the frontend, we'll keep things simple with some basic HTML, CSS and some JavaScript to handle SSE messages. Charting is provided by Chart.js.
The full source code for the project can be found here.
Camel Route
Here's what our Camel route looks like:
@ApplicationScoped
public class Routes extends RouteBuilder {
    @Inject
    CamelReactiveStreamsService reactiveStreamsService;

    @Inject
    MetricsService metricsService;

    @Outgoing("runtime-metrics")
    public Publisher<RuntimeMetrics> getDataFromCamelRoute() {
        return reactiveStreamsService.fromStream("runtime-metrics", RuntimeMetrics.class);
    }

    @Override
    public void configure() throws Exception {
        // Stream subscription happens when the browser connects to the SSE
        // Therefore, we ignore ReactiveStreamsNoActiveSubscriptionsException
        onException(ReactiveStreamsNoActiveSubscriptionsException.class)
                .handled(true);

        from("timer:updateMemoryInfo?period=5s")
                .process(exchange -> exchange.getMessage().setBody(metricsService.getRuntimeMetrics()))
                .to("reactive-streams:runtime-metrics");
    }
}
A timer will fire every 5 seconds. Next, a processor calls a service that will fetch some interesting metrics and store them in a POJO as the message exchange body. Finally, the message is routed to a Reactive Streams channel named runtime-metrics.
Metrics Service
MetricsService obtains metrics from the Micrometer MeterRegistry. For example, to get the system CPU usage.
@Singleton
public class MetricsService {
    @Inject
    MeterRegistry meterRegistry;

    double getSystemCpuUsage() {
        Gauge gauge = meterRegistry.find("system.cpu.usage").gauge();
        if (gauge == null) {
            return 0.0;
        }
        double cpuPercent = gauge.value() * 100;
        return Math.round(cpuPercent * 100.0) / 100.0;
    }
}
RESTEasy SSE endpoint
The endpoint that handles the SSE looks like this.
@Path("/metrics")
public class RuntimeMetricsResource {
    @Inject
    @Channel("runtime-metrics")
    Multi<RuntimeMetrics> runtimeMetrics;

    @GET
    @RestStreamElementType(MediaType.APPLICATION_JSON)
    public Multi<RuntimeMetrics> runtimeMetrics() {
        return runtimeMetrics;
    }
}
We inject the runtime-metrics channel and use it as the return value in the SEE endpoint method. Usually you would annotate an SSE endpoint with @Produces(MediaType.SERVER_SENT_EVENTS). But in this case, we can omit it and instead use @RestStreamElementType to specify that the SSE data elements should be serialized to JSON.
The basic structure of the RuntimeMetrics class looks like this. We'll be collecting some simple memory and CPU metrics.
public class RuntimeMetrics {
    private final double memoryUsed;
    private final long openFileDescriptors;
    private final String processCpuUsage;
    private final String systemCpuUsage;
    private long timestamp;

    // getters / setters omitted for brevity
}
Running the application
Start the application in 'dev' mode and test the /metrics endpoint.
mvn quarkus:dev
With the application running, use cURL to connect to the metrics endpoint.
curl localhost:8080/metrics
You should see a stream of messages as the Camel timer fires every 5 seconds.
data:{"memoryUsed":12605.34375,"openFileDescriptors":560,"processCpuUsage":"0.16","systemCpuUsage":"4.46","timestamp":1693218265190}

data:{"memoryUsed":12595.109375,"openFileDescriptors":560,"processCpuUsage":"0.25","systemCpuUsage":"1.94","timestamp":1693218270196}

data:{"memoryUsed":12586.984375,"openFileDescriptors":560,"processCpuUsage":"0.05","systemCpuUsage":"1.68","timestamp":1693218275198}

data:{"memoryUsed":12586.21875,"openFileDescriptors":560,"processCpuUsage":"0.05","systemCpuUsage":"1.70","timestamp":1693218280202}
We can view the data in a nicer format via the web frontend. Open a browser to http://localhost:8080. The charts should start to fill up with data as each event is published.
Describing all of the frontend code is outside the scope of this article. In basic terms, an EventSource is created for the /metrics path. The charts are updated on each onmessage event.
The JavaScript looks something like this.
const eventSource = new EventSource("/metrics");
eventSource.onmessage = (event) => {
    // Parse the JSON event data containing the metrics
    const message = JSON.parse(event.data)
    // Update charts
};
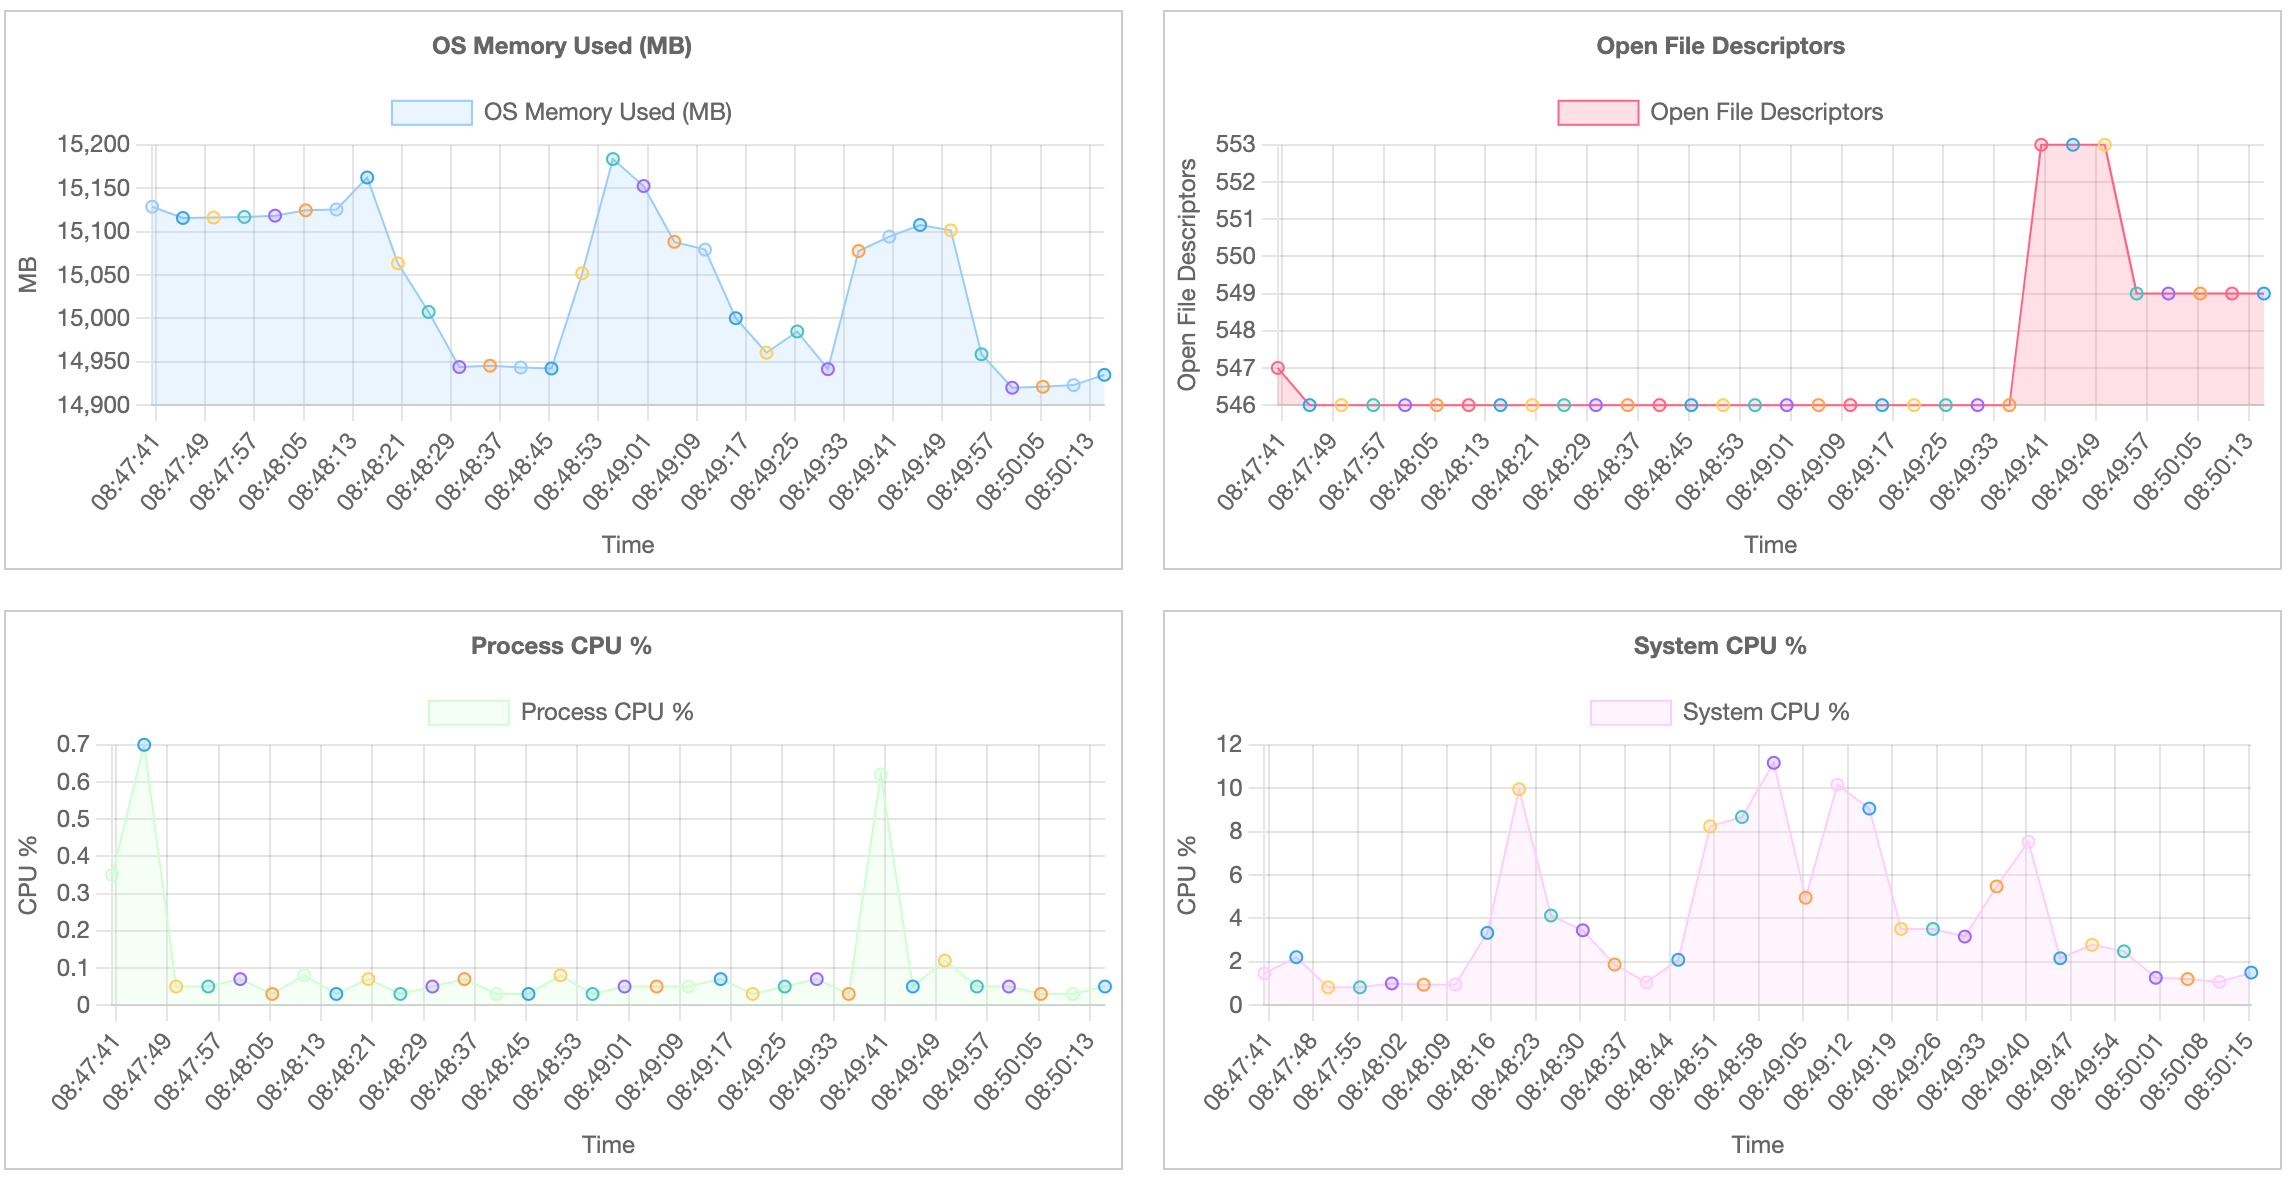
Leave the application running for a minute or two and you should have collected a decent set of data points for the charts to look something like this.
Conclusion
That was a simple demo of making Camel work with Server Sent Events on Quarkus. You can create more complex applications and use different components if desired.
The SmallRye Reactive Messaging Camel connector is a useful project if you want to bridge the reactive world with Camel. The links below offer further reading on the subject.
- SmallRye Reactive Messaging Camel Connector documentation
- SmallRye Reactive Messaging Camel Quarkus extension documentation
- Camel Quarkus Reactive Streams extension documentation
This demo only covered emitting SSEs. It did not demonstrate a client connecting to the SSE endpoint and consuming the events. However, there is a test case which demonstrates using the quarkus-rest-client-reactive extension to consume the RuntimeMetrics events.
Happy coding!